Learning eBPF - Chapter 3: Anatomy of eBPF Programs
TL;DR
Before going through this chapter, I recommend reading the previous chapters in this series.
They will give you a better understanding of what we are building toward in this chapter.
In the previous chapter, we wrote a simple “Hello World” eBPF program using the Rust Aya framework.
In this chapter, we use the same “Hello World” idea, but look at it more closely to understand what happens behind the scenes and what Aya handles for us.
This chapter focuses on the stages of an eBPF program, starting from source code and ending with execution inside the kernel.
An eBPF program is ultimately just a set of eBPF bytecode instructions.
In theory, it is possible to write eBPF programs directly in bytecode, similar to writing assembly. However, humans prefer working with higher-level languages.
Today, most eBPF programs are written in C, and then compiled into eBPF bytecode.
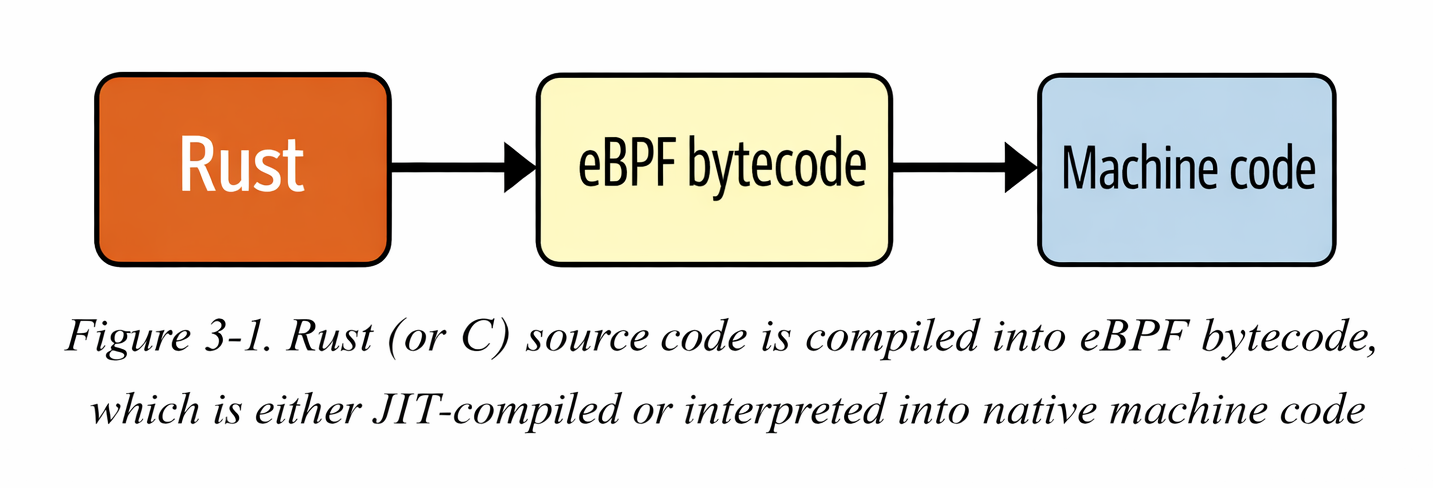
Conceptually, eBPF bytecode is executed by the eBPF virtual machine inside the Linux kernel.
The eBPF Virtual Machines
The eBPF virtual machine, like any other virtual machine, is a software implementation of a computer. It takes an eBPF program in the form of bytecode instructions and converts them into native machine instructions so they can run inside the kernel.
In the earlier days, eBPF used an interpreter. Every time a program ran, the interpreter examined each instruction, translated it into CPU instructions, and then executed it. Later, the JIT (Just-In-Time) compiler was introduced. With JIT compilation, there is no involvement of an interpreter during execution, and the generated CPU instructions run directly on the processor.
Compilation means that the conversion from eBPF bytecode to native machine instructions happens only once, when the program is loaded into the kernel.
eBPF bytecode consists of a set of instructions, and these instructions operate on eBPF registers. This means eBPF has its own set of virtual registers, which are not the same as the CPU’s registers. However, these eBPF registers are mapped to the CPU registers during execution. Because of this design, the eBPF instruction set can be easily and efficiently mapped to common CPU architectures.
eBPF Registers
In the eBPF virtual machine, there are 10 general-purpose registers, numbered from R0 to R9. There is one additional register, R10, which is read-only and cannot be written to.
As an eBPF program is executed these register are used to store the data to keep the track of the program states
It’s important to understand that these eBPF registers are virtual machine registers, not CPU hardware registers. They are implemented in software as part of the eBPF virtual machine.
You can see these registers enumerated from BPF_REG_O to BPF_REG_1 in the Linux kernel source code, defined in the header file.
The context argument from the eBPF program is get's stored in the Register 1 before the execution begins and the return values are stored in the Register 0. Before calling any function from the eBPF code.
The arguments of the function are placed between the Register 1 to Register 5, If a function takes fewer than five arguments, only the required registers are used.
so the overall structure of the registers look like
- •
r0-> return value - •
r1 - r5-> arguments - •
r5 - r9-> calle-saved - •
r10-> stack pointer(read-only)
eBPF Instructions
In the same header.file there is a structure bpf-insn which represent a BPF instruction.
struct bpf_insn {
	__u8	code;		/* opcode */                         // 1
	__u8	dst_reg:4;	/* dest register */                  // 2
	__u8	src_reg:4;	/* source register */
	__s16	off;		/* signed offset */                  // 3
	__s32	imm;		/* signed immediate constant */
};
This structure is total of 64 bits which is 8 bytes. now let's go point to point to understand this instruction.
1 -> Each instruction has the opcode, which defines what operation does the instruction need to be performed for ex: ADD r1, r2, MOV r0, 1 and JMP +4
2 -> These two max instructions both destination_register and source_register. They help you with the questions like, "which register to read?" and "which register to write?".
3 -> Offset is used to jumps and memory access and Immediate value is used to store the constant values.
In eBPF 8 bytes instructions are used because they are simple and are easy to verify and compile But always we can't fit instructions in 8 bytes we need to extra instruction size.
For this we can use two consecutive instruction sets this combine will become 16 bytes.
Whenever a program in loaded in to kernel, it is repsented by the series of instructions like this:
[bpf_insn, bpf_insn, bpf_insn, ...]
The verifier performs multiple checks to make sure that code is safe to run.
Most of the time opcode only fails due to these:
- • Loading the values into the registers.
- • Storing a value from register into memory.
- • Performing arithmetic operations such as adding a value to the contents of a register.
- • Jumping to a different instruction if a particular condition is satisfied.
eBPF Hello World from a Network Interface
Until now, in the previous chapters, we saw a "Hello World" program triggered by a system call using kprobes.
Now let’s look at a program that prints "Hello World" whenever a network packet is detected.
Packet processing is one of the most common applications of eBPF programs. We will learn more about this topic in later chapters.
Now, let’s understand the core idea of an eBPF program which can be triggered for every packet of data that arrives at a network interface.
The kernel has full access to the incoming packet. It can inspect the data and even modify it if needed. It also decides what to do with the packet, whether to pass it, drop it, or redirect it elsewhere.
Let's see the code now this following code doesn't do anything with the network packet; it simply writes the Hello World and a counter to trace the pipe whenever a network packet is traced
// 1
#[xdp]
pub fn xdp_log(ctx: XdpContext) -> u32 {
    // 2
    match try_xdp_hello(ctx) {
        Ok(ret) => ret,
        Err(_) => xdp_action::XDP_ABORTED,
    }
}

// 3
#[map]
static COUNTER: Array<u32> = Array::with_max_entries(1, 0);

fn try_xdp_hello(ctx: XdpContext) -> Result<u32, u32> {
    info!(&ctx, "Hello World!", COUNTER); // 4

    let key = 0; // 5
    if let Some(counter) = COUNTER.get_ptr_mut(key) {
        unsafe { // 6
            *counter += 1;
        }
    }
    Ok(xdp_action::XDP_PASS)// 7
}
Now let's go through the every part of the code:
1 -> The macro #[xdp] makes sure that the function which we have written is the xdp program which is related to the network packets.
2 -> We delegate the logic to try_xdp_hello and convert any error into XDP_ABORTED.
3 -> COUNTER is a global BPF map that persists across program invocations and stores the total number of packets processed.
4 -> We used info macro in here to have the content logs
5 -> We are using a key value here to get the mut pointer as we have only one value in array.
6 -> We use unsafe because we are dereferencing a raw pointer returned by the map.
7 -> If everything works well, Then let the packet continue through the normal networking stack.
Compiling a Rust eBPF Program with Aya
In the C-based eBPF workflow, programs are compiled using:
clang -target bpf -O2 -g -c hello.bpf.c -o hello.bpf.o
In contrast, when using Rust with Aya, we simply run:
cargo build
or sometimes we use this command
cargo +nightly build -Z build-std=core --target bpfel-unknown-none
Under the hood, Aya’s build.rs compiles the eBPF crate for the bpfel-unknown-none target and embeds the resulting eBPF object file into the user-space binary.
Even though we write Rust, the final output is still:
An ELF relocatable object file containing eBPF bytecode.
The Linux kernel does not care whether the source was C or Rust. It only understands eBPF bytecode packaged inside an ELF file.
Verifying the Generated eBPF Object
We can confirm that Rust produced a valid eBPF object using the file command:
file target/debug/build/xdp-log-*/out/xdp-log
Output:
ELF 64-bit LSB relocatable, eBPF, version 1 (SYSV), with debug_info, not stripped
This tells us:
- • The file is an ELF object
- • It contains eBPF bytecode
- • It is relocatable (not directly executable)
- • Debug information is included
This is equivalent to the hello.bpf.o file generated in the C workflow.
Inspecting the eBPF Bytecode
To inspect the generated eBPF instructions, run:
llvm-objdump -d target/debug/build/xdp-log-*/out/xdp-log
The output will look like:
file format elf64-bpf
Disassembly of section .text:
The file format confirms that Rust successfully produced an ELF object containing eBPF bytecode.
Below is an example of the generated assembly output:
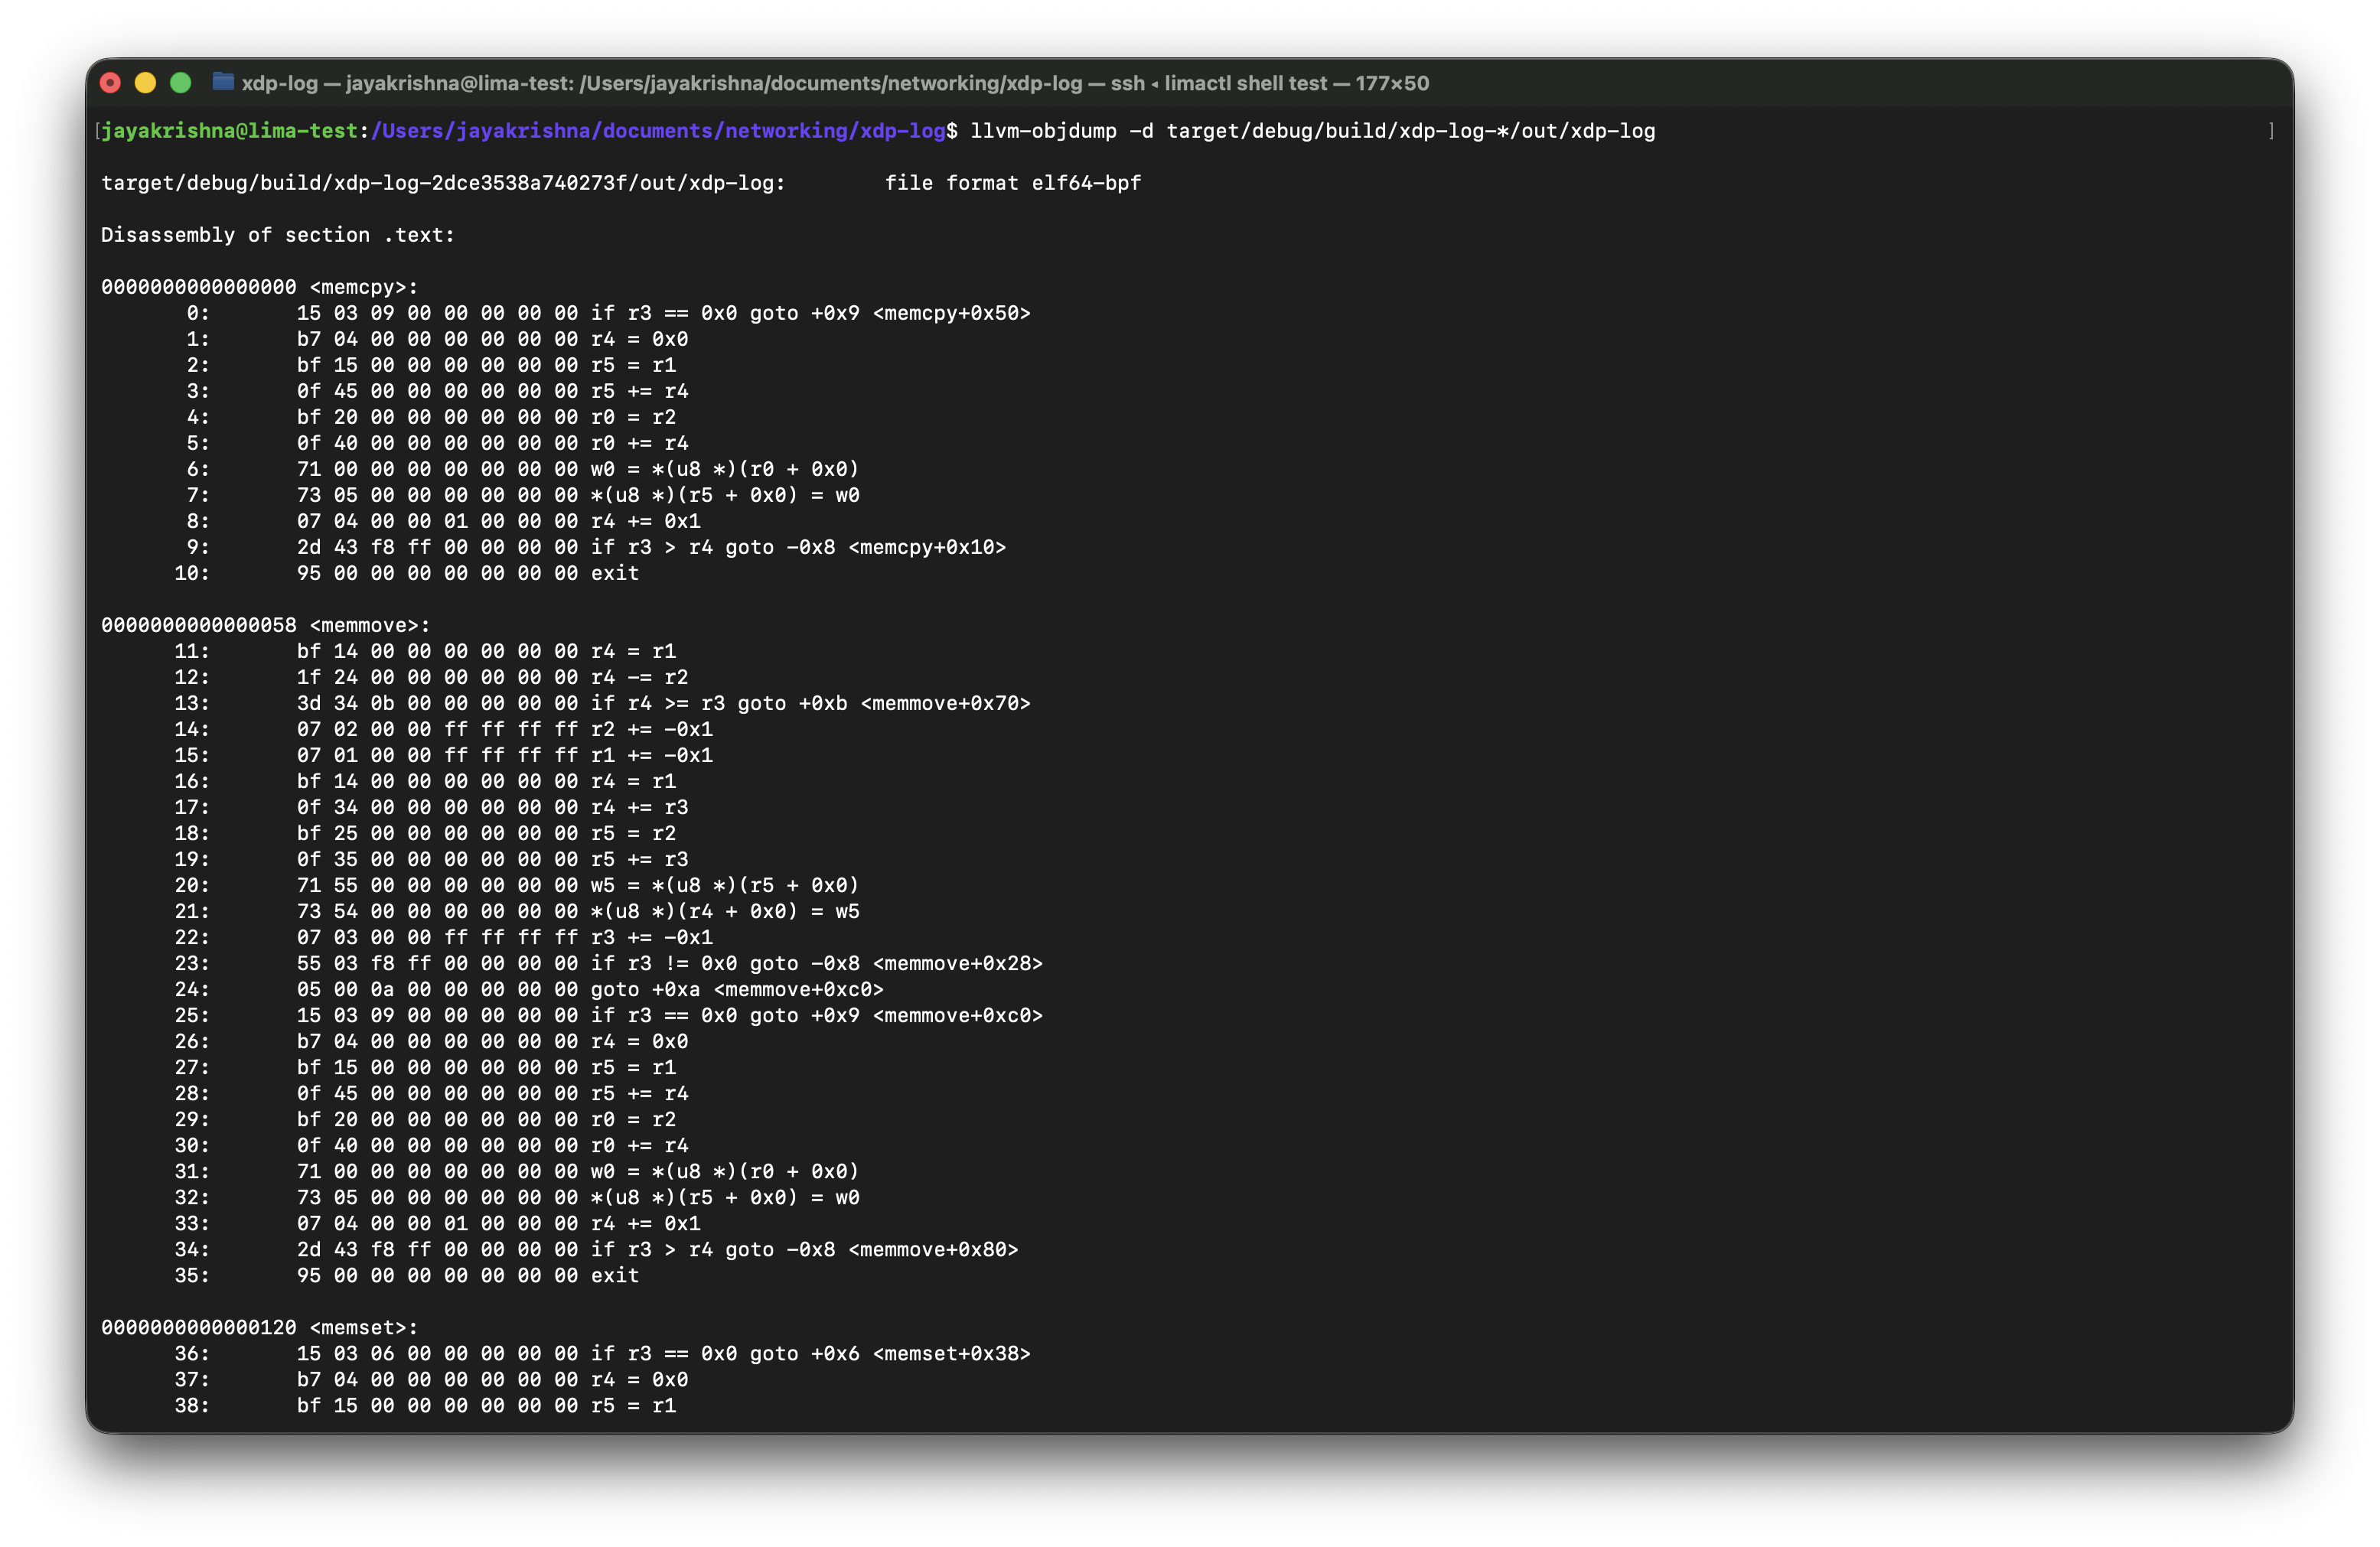
There are few sections we need to focus on in this terminal output.
- •
.text- contains compiler-generated helper functions (memcpy, memset, etc.) - •
xdp- contains our actual XDP program - •
kprobe- appears if a kprobe program is compiled
The most important section here is xdp.
This is where the XDP function that we wrote gets compiled into eBPF instructions.
You will see instructions using BPF registers (r0–r10) and helper calls.
The numbers on the left side are the offsets, but there are 2 tyeps:
- • function offsets -> Hexadecimal numbers at the function like this
0000000000000038 <xdp_log>. - • instructions offsets -> Decimal numbers on the left like
1:,2:and so on.
In here if we need to know the byte location of the instruction for that we have a formula that is:
real_byte_offset = instruction_offset × 8
For example, consider the following lines from the disassembly:
267:	b7 00 00 00 02 00 00 00	r0 = 0x2
268:	95 00 00 00 00 00 00 00	exit
This corresponds to the Rust code:
Ok(xdp_action::XDP_PASS)
Let's know about the offsets in here:
- • Instruction
267is located at byte offset267 × 8 = 2136 - • Instruction
268is located at byte offset268 × 8 = 2144
This fixed-size instruction format is one of the reasons the eBPF verifier can efficiently analyze control flow and validate jump targets.
And when comes to the logic:
- •
r0is the return value register in eBPF. - •
0x2is the numeric value ofXDP_PASS. - exit means the program is returning that value to the kernel.
So effectively, these two assembly instructions mean:
Set the return value to
XDP_PASSand exit the program.
Rust vs C: The Compilation Pipeline
Although the development experience differs, the final pipeline is conceptually identical.
C Workflow
clang → ELF (eBPF bytecode) → loader → kernel
Rust + Aya Workflow
rustc (LLVM) → ELF (eBPF bytecode) → embedded via build.rs → loader → kernel
At runtime, the kernel only sees:
ELF + eBPF bytecode
The source language becomes irrelevant once the program reaches the eBPF verifier.
Loading the Program into the Kernel (Rust + Aya)
In the C-based workflow, we use bpftool to load the compiled eBPF object file into the kernel:
bpftool prog load hello.bpf.o /sys/fs/bpf/hello
Here, bpftool acts as the user-space loader that:
- Sends the ELF file to the kernel
- Triggers the eBPF verifier
- Pins the program in the BPF filesystem
In Rust with Aya, we do not manually invoke bpftool. Instead, our user-space Rust program acts as the loader.
When we call:
program.load()?;
program.attach(&iface, XdpFlags::default())?;
Aya internally performs the same bpf() syscalls that bpftool would use.
Conceptually, the pipeline becomes:
C Workflow:
clang → ELF → bpftool → kernel
Rust + Aya Workflow:
rustc → ELF → Aya userspace loader → kernel
Aya abstracts the low-level syscall interface, allowing us to load and attach programs programmatically rather than via command-line utilities.
Even after loading with Aya, we can still inspect programs using:
bpftool prog list
bpftool map list
The kernel ultimately sees the same eBPF bytecode, regardless of whether it was loaded using bpftool or Aya.
Inspecting the Loaded eBPF Program (Rust + Aya)
After loading the XDP program using Aya:
program.load()?;
program.attach(&iface, XdpFlags::SKB_MODE)?;
We can inspect the program directly from the kernel using bpftool.
We have commands to list the loaded program:
sudo bpftool prog list | grep xdp
In this command we can remove the grep xdp to list all the programs not only xdp programs.
And to Inspect the program details we have a command which is:
sudo bpftool prog show id <ID> --pretty
This image shows how the output for these commands looks like:
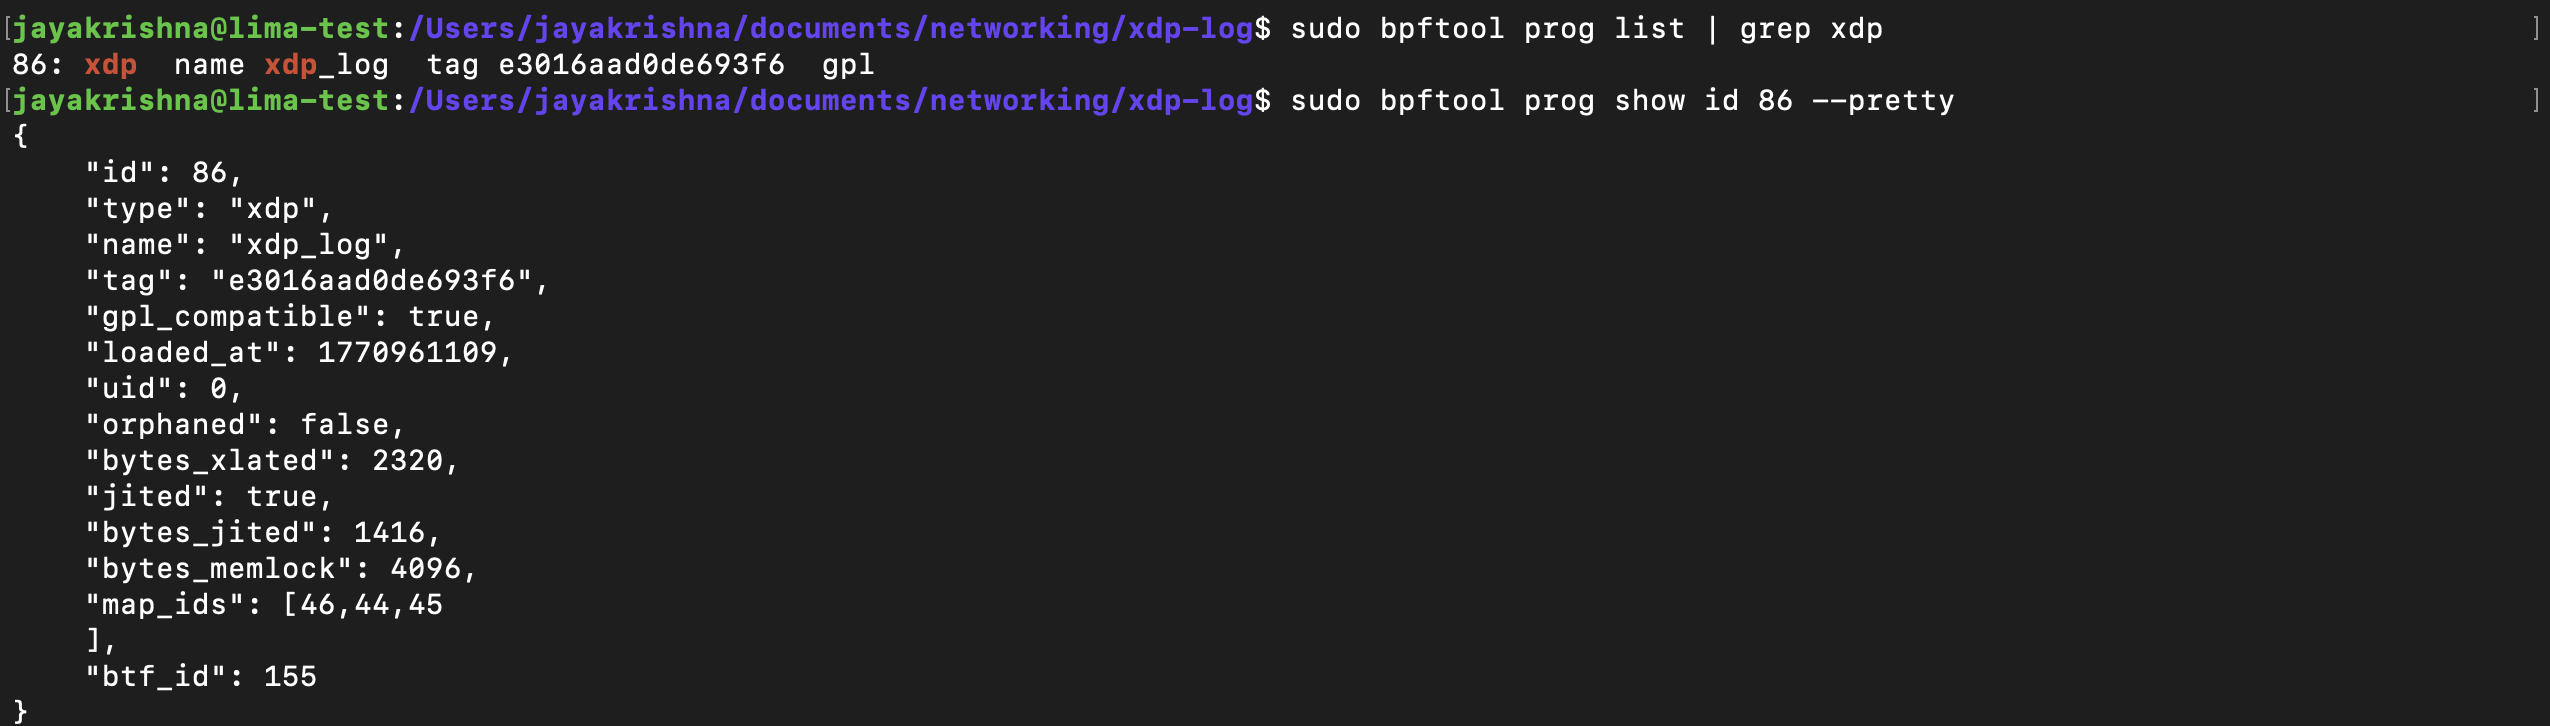
Let’s break down the important fields:
- • id → Kernel-assigned program identifier (unique while alive).
- • type → Program type (xdp in our case).
- • name → Function name inside the ELF (#[xdp] pub fn xdp_log).
- • tag → Hash of the eBPF instructions (used for deduplication).
- • gpl_compatible → Determined by the declared license section.
- • bytes_xlated → Size of verified eBPF bytecode.
- • jited → Indicates whether JIT compilation is enabled.
- • bytes_jited → Size of native machine code after JIT in bytes.
- • map_ids → IDs of maps associated with this program.
- • btf_id → ID of BTF (type metadata) for debugging and introspection.
In here in these fields we can use multiple fields to get the details of the program. like id, type, name, tag and also we can pin the program to the file system using bpftool prog pin id <id> /sys/fs/bpf/<name>.
See, You could have multiple programs with the same name, even there could be multiple program instances with the same tag but the id and the pinned path will be always unique.
There is a similar command to list the loaded maps:
sudo bpftool map list
And to inspect the each map details we have a command which is:
sudo bpftool map show id 45 --pretty
Checkout this image to understand the output of the command:
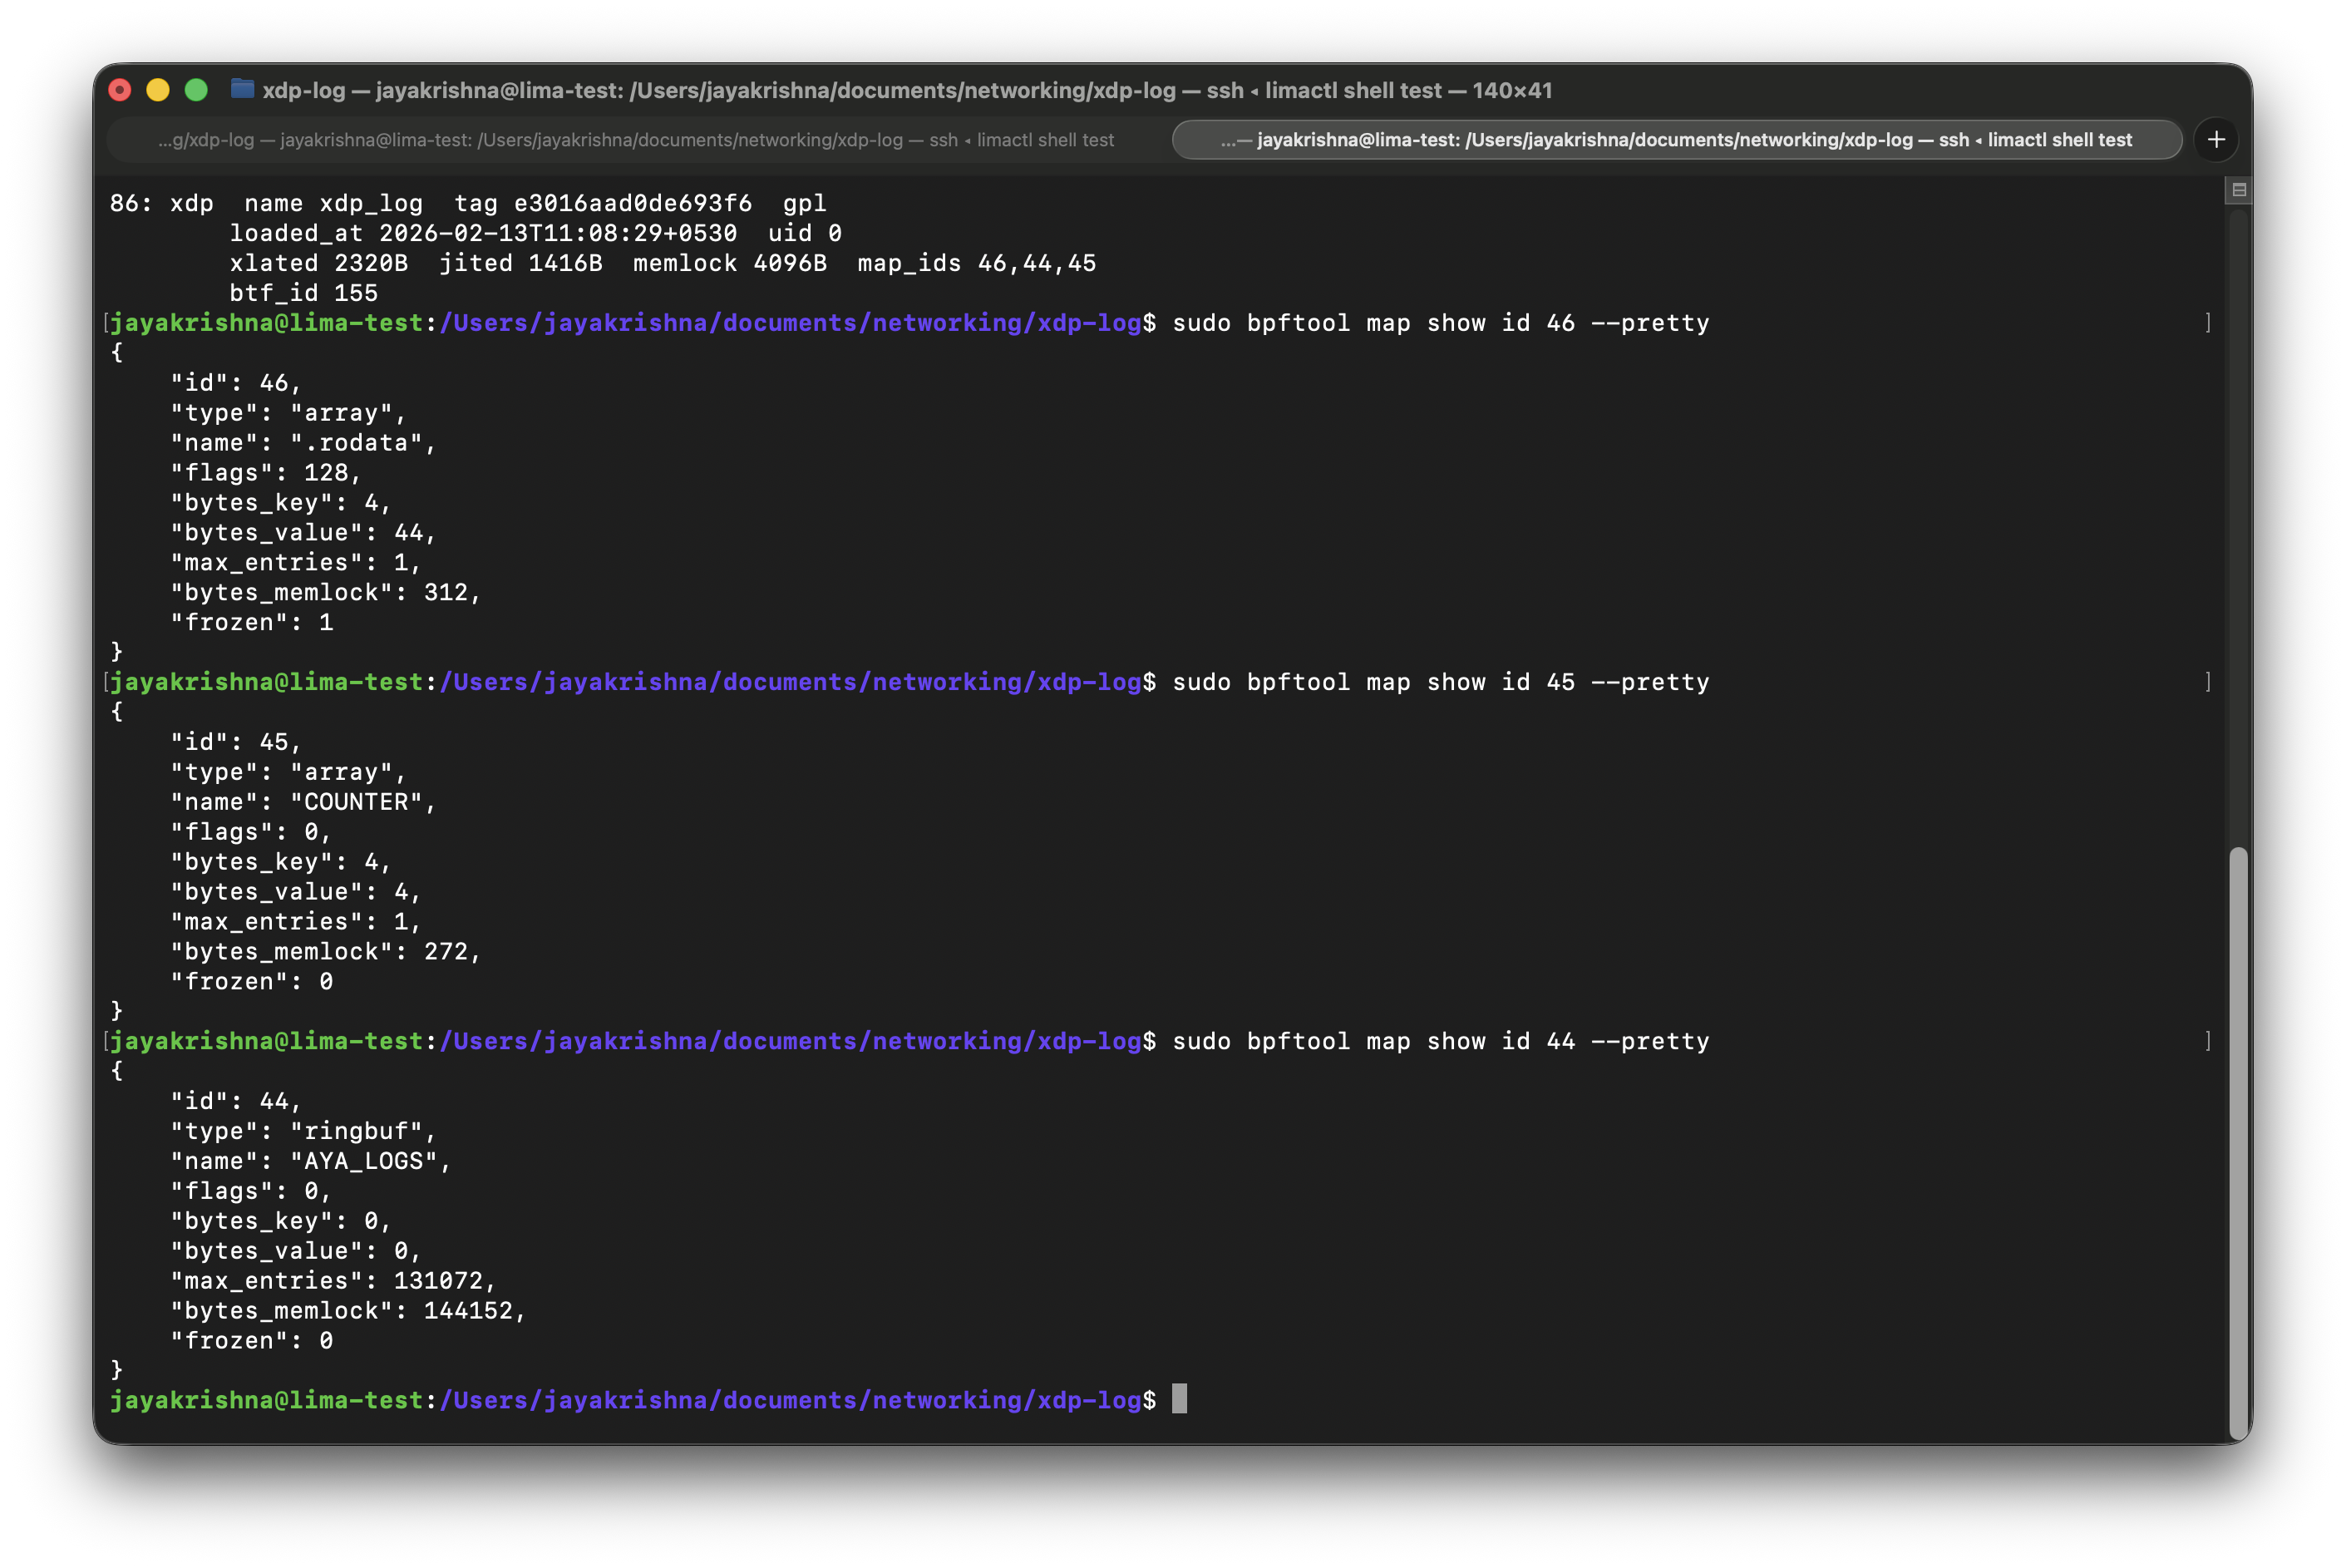
Let's breakdown the important fields present in the output:
- • type → Map type (array).
- • bytes_key → Key size in bytes (4 bytes = u32).
- • bytes_value → Value size in bytes (4 bytes = u32).
- • max_entries → Maximum number of elements (1).
- • frozen → Whether the map is immutable (0 = mutable).
In these output you may have seen the map type which is:
{
  "type": "ringbuf",
  "name": "AYA_LOGS"
}
This is automatically created by Aya for the info!() logging macro.
Aya uses a ring buffer map to send log messages from kernel space to user space.
The Translate Bytecode and JIT-Compiled machine code
As if you observed in the prog list output above there are 2 fields present in there those are
- • bytes_xlated → This tells us how many bytes of "translated" eBPF code there are.
- • bytes_jited → JIT-compiled machine code in bytes.
so there are 2 commands to inspect the details of these compiled programs:
- •
bpftool prog dump xlated id <id>→ This command will provide code that looks very similar to the disassembled code you saw earlier in the output fromllvm-objdump. - •
bpftool prog dump jited id <id>→ This command will give you the assembly code generated by the JIT compiler.
Attaching and Detaching to an Event
The program type of any program must need to match the type of the event it is attached to. So, if we have a xdp program then we must attach it to the network interface.
So, now let's we can attach our program to the network interface. By using
bpftool net attach xdp id <id> dev eth0
After doing this, you can verify that the program is attached by running bpftool net list and checking the output for the xdp section.
It Looks like this:
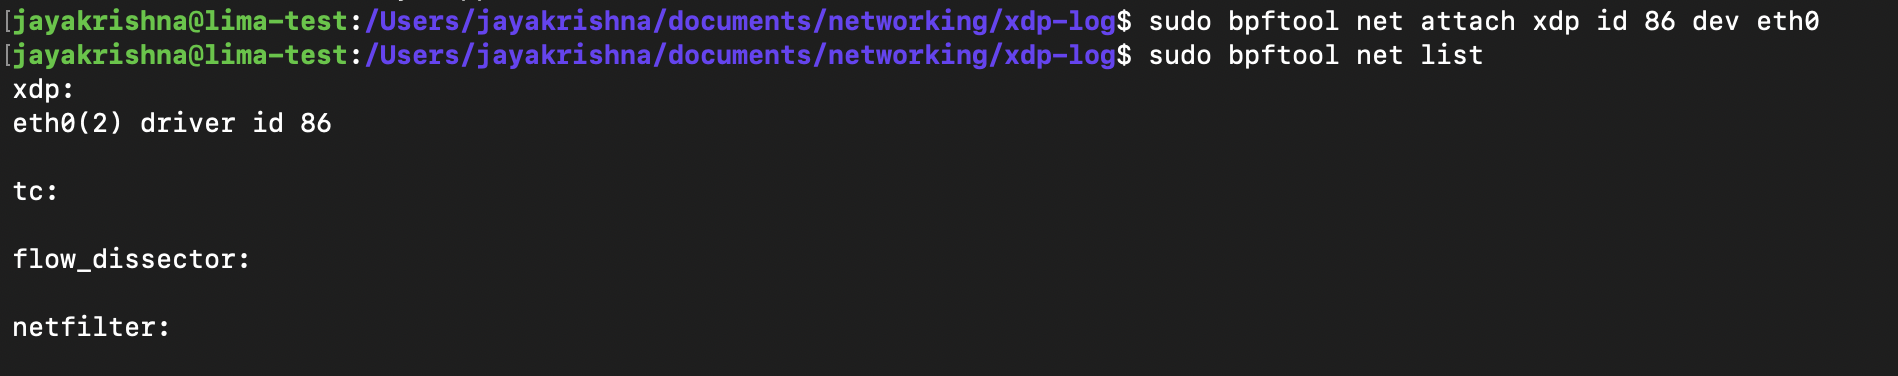
If you correctly check the output here, along with the xdp section, there are other network stack events like tc, file_dissector and net_filter. we can discuss more about them in upcoming chapters.
Similarly to xdp we can attach and detach programs to network interfaces.
The command for this looks like:
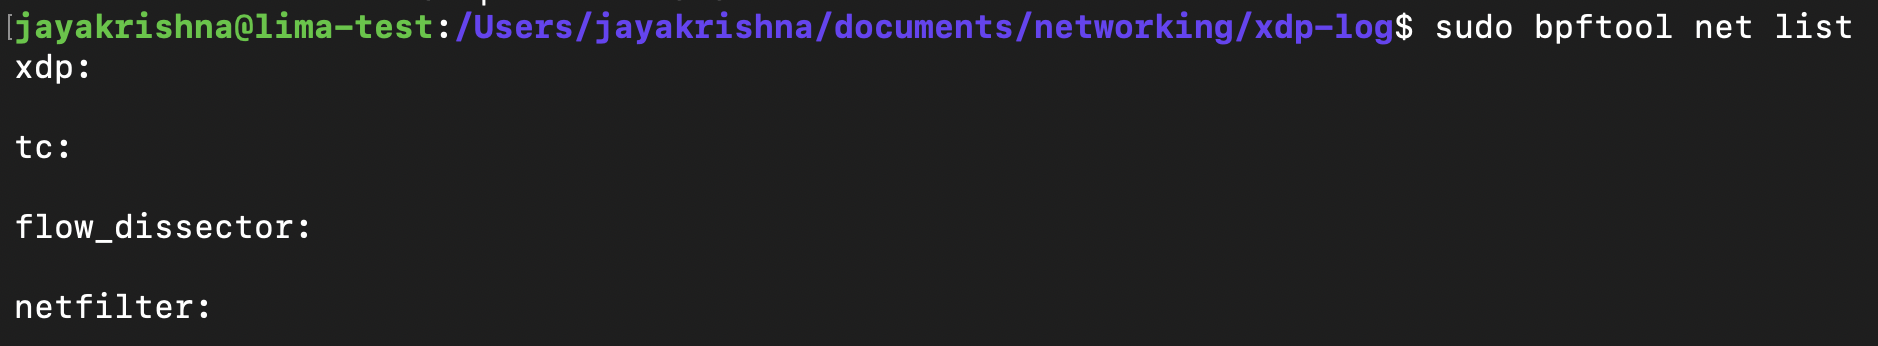
sudo bpftool prog detach <program> dev eth0
so now if you check the the net list it probably looks like this:
In here we can even inspect the network interface by using ip link you'll look output which will be like this:
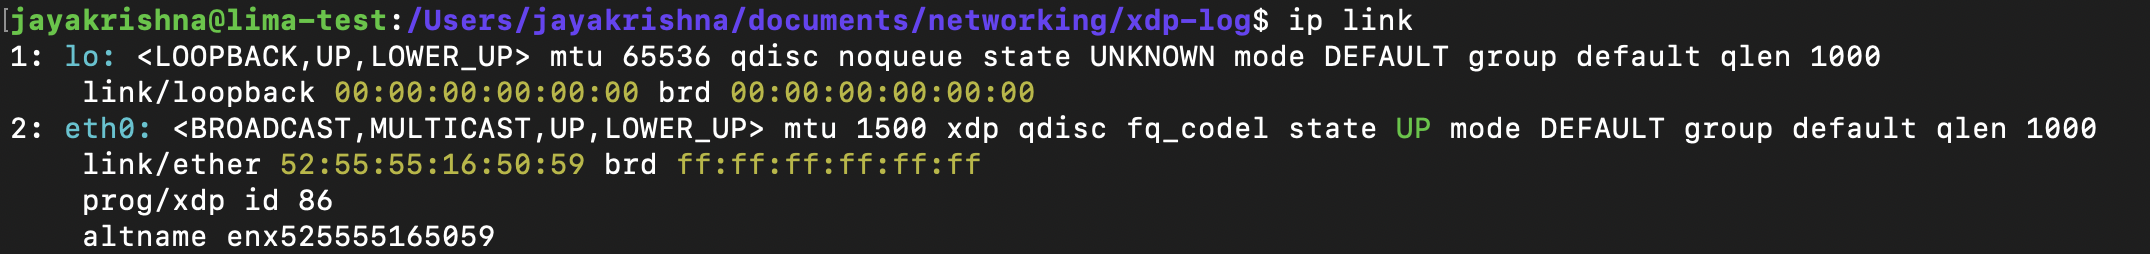
In this example there are two interfaces: the loopback interface lo, which is used to send traffic to processes on this machine; and the eth0 interface, which connects this machine to the outside world.
Global Variables
As you learned in the previous chapter, an eBPF map is a data structure that can be accessed from an eBPF program or from user space. Since the same map can be accessed repeatedly by different runs of the same program, it can be used to hold state from one execution to the next. Multiple programs can also access the same map. Because of these characteristics, map semantics can be repurposed for use as global variables.
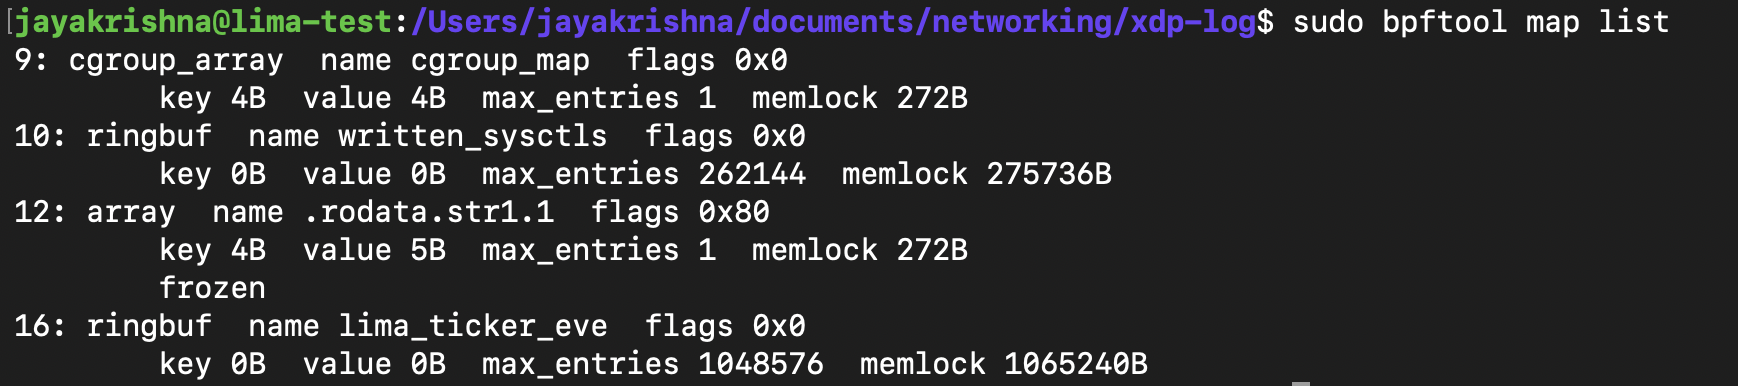
So here to check in a program, how many global variables can be used in an eBPF program. we have a command, so for now let's check how many maps we are using in our Hello World counter program.
sudo bpftool map list
output for this is:
So you can check this program in this branch
Summary
In this chapter, we built a simple XDP program using Rust and Aya and followed it all the way from source code to kernel execution.
We compiled our Rust eBPF program into an elf64-bpf object file, inspected its bytecode using llvm-objdump, and understood how eBPF instructions are structured as fixed 8-byte operations with instruction offsets.
We then loaded the program into the kernel using Aya, attached it to a network interface, and inspected it using bpftool. This allowed us to observe program IDs, JIT compilation details, associated maps, and kernel metadata such as BTF information.
We also learned that eBPF programs are reference-counted kernel objects, when the user-space loader exits, the program is automatically unloaded unless explicitly pinned.
By the end of this chapter, we not only wrote an eBPF program in Rust, but understood how it is compiled, loaded, inspected, and managed inside the Linux kernel.